Sugarbeet production in the Pacific Northwest is located primarily from south central Idaho to southeastern Oregon. Beets are produced by growers who are part of Amalgamated Sugar Company (ASCO), a grower-owned cooperative. From 2011 to 2020 an average of 73,700 ha year-1 of sugarbeets were harvested in this growing area (NASS, 2022).
Nitrogen (N) supply is an important management factor for sugarbeet production because both under- and over-supplying N relative to plant needs can result in decreased profits (Stout, 1960). Under supplying N reduces root and sucrose yields while over supplying N may decrease root sucrose content and increased root impurities which subsequently reduces sucrose extraction efficiency (Carter and Traveller, 1981; James et al. 1971). In addition, over supplying N can lead to increased N losses to the environment as well as unnecessary cost to the grower. Because of this unique relationship between N and sugarbeet quality/quantity, periodic research studies have been conducted in the Northwest U.S. sugarbeet growing area to determine sugarbeet N requirements.
Historically, a yield goal N management (YGNM) approach has been utilized in The ASCO growing area. The basis of YGNM is to determine the total available soil N supply [soil (0-0.9 m) NO3-N and NH4-N + fertilizer N] needed to optimize sucrose and root yields at measured yield goals. Using this approach, realistic sugarbeet root yield targets for each field were multiplied by a research derived N requirement factor (Nr). These Nr factors have been continually updated over the years, including recently from research by Tarkalson et al. (2016). The Nr factors represent the kg of N needed to grow a Mg of sugarbeet roots (kg N Mg-1 roots). Past Nr factors were, 1977: 4 kg N Mg-1 roots, 1997: 3.75 kg N Mg-1 roots, and 2016: 3 kg N Mg-1 roots. Tarkalson et al. (2016) and Tarkalson et al. (2018) found that although yields were increasing over time, the amount of N required to achieve those yields remained steady. Further, they showed the YGNM approach often leads to over supplying N. For this reason, it was suggested that a static range N management (SRNM) approach be considered. The SRNM approach is based on supplying a narrow range of N supply to optimize sugarbeet yields that is independent of yield. Rather than setting a fixed N supply, the static N range accommodates for variation in N response due to site factors unrelated to yield such as soil properties, irrigation methods, and climate (King and Tarkalson, 2017). Site specific field data from sugarbeet producers can be used to determine where in the static N range their optimal N supply sits.
Additional research was needed to provide addition data to assess the appropriate N management approach under the current higher yields. Since the last research studies assessing N supply and sugarbeet yield were concluded in 2011, average sugarbeet root yields have increased from 74.1 Mg ha-1 (2007 to 2011 average) to 88.2 Mg ha-1 (2014 to 2018 average) an increase of 14.1 Mg ha-1 (Figure 1). The objective of this study was to evaluate the N requirement of sugarbeet grown at these higher yields and to provide added additional data to determine the appropriateness of the SRNM as an alternative to the YGNM approach.
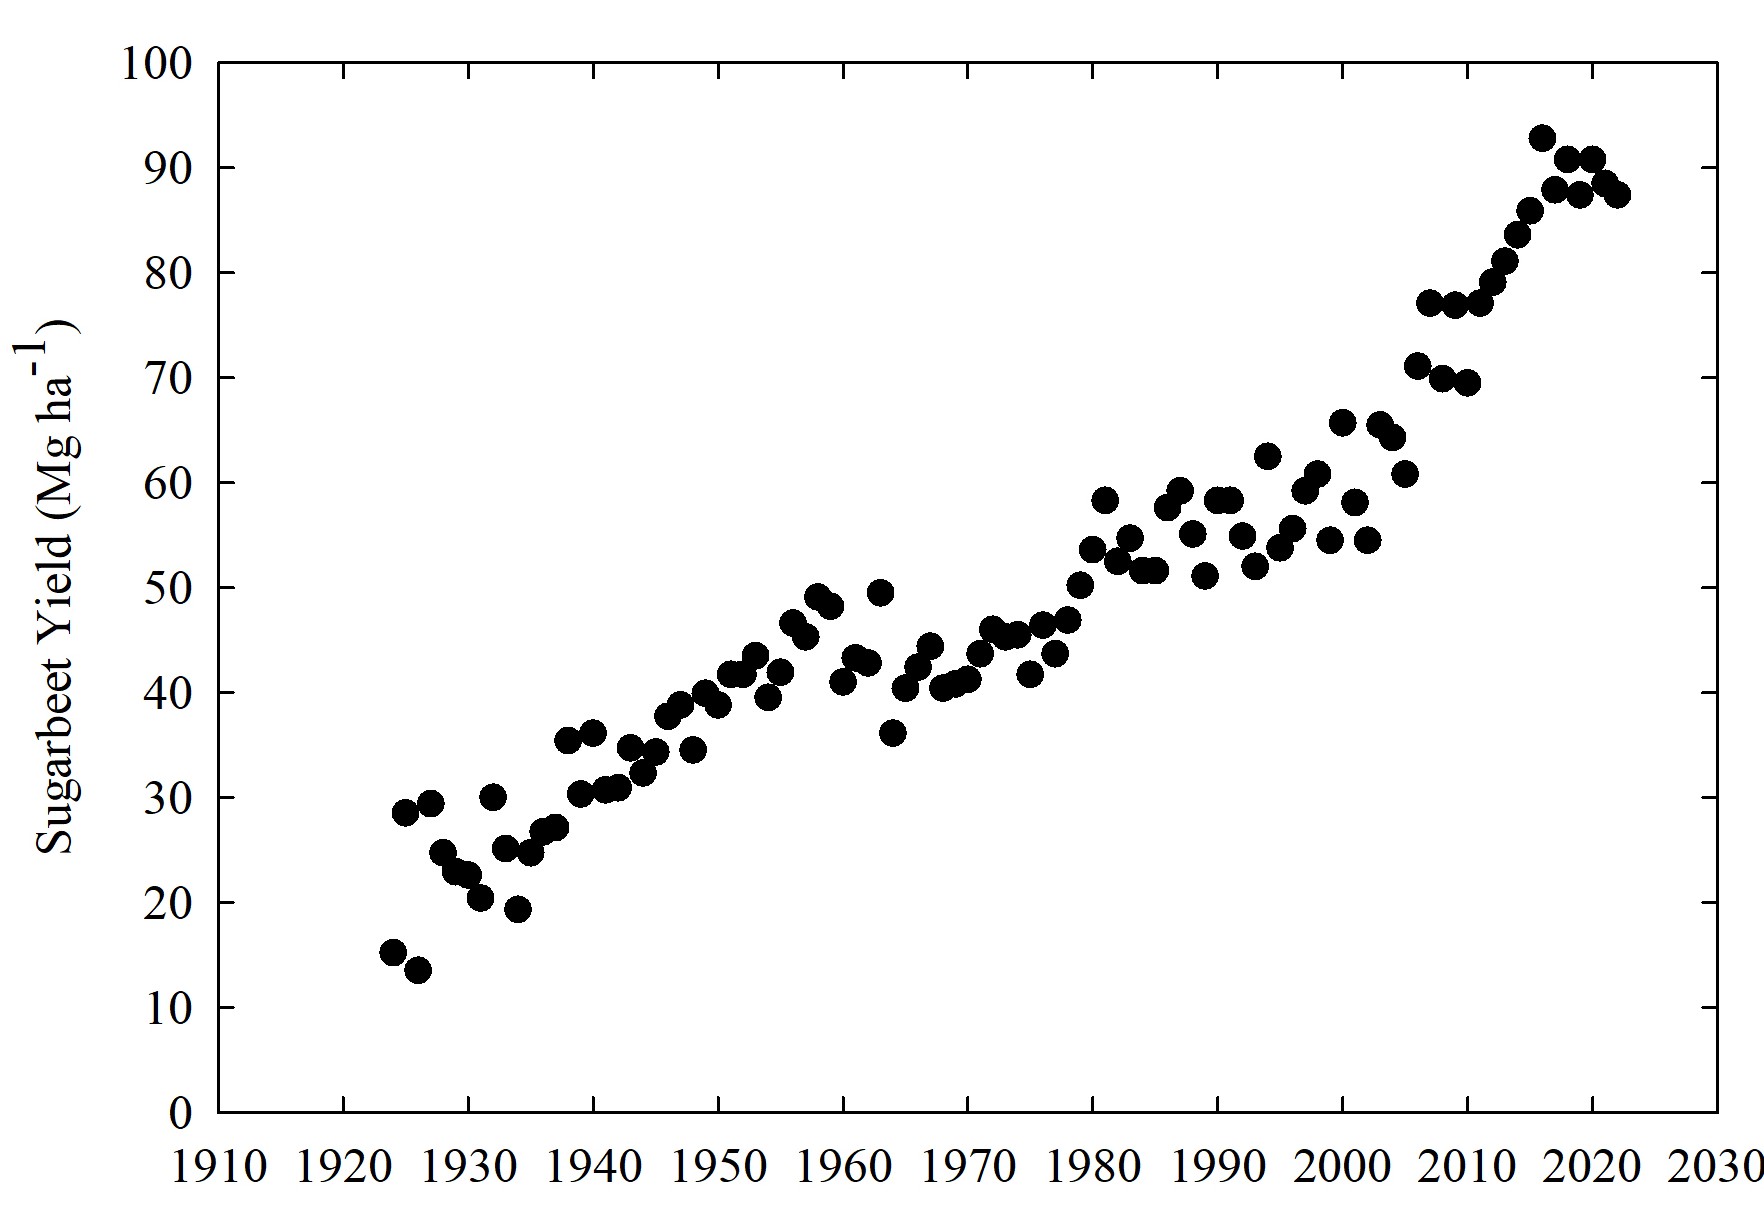
Figure 1. Average sugarbeet yield over time in Idaho
Materials and Methods
Site Characteristics
The studies in this paper were located at 6 research sites (Table 1) in 2018 and 2019. The sites covered the range of commercial sugarbeet production in southern Idaho, from Minidoka County in the east to Payette County in the west. All sites had the same soil texture (silt loam), tillage practice (conventional), spring soil sample depth (0-0.9 m), variety planted (BTS251N), row spacing (0.56 m), N source (urea), and N application timing (pre-plant) (Table 1 and Table 2). Other cultural and experimental practices varied across sites (plot size, N application rate, treatment replications, irrigation system, planting date, glyphosate application timings, and harvest date) (Table 2). Planting dates ranged from late-March through April and harvest dates ranged from late-September to mid-October.
Table 1. Site information.
| City, County | Year | Soil Texture | Plot Size | Tillage | Irrigation System | Variety | No. Treatment Replications |
| Jerome, Jerome | 2018 | silt loam | 2.23m × 12.19m | conventional | wheel line | BTS251N | 8 |
| Kimberly, Twin Falls | 2018 | silt loam | 2.23m × 9.14m | conventional | solid set sprinkler | BTS251N | 8 |
| Payette, Payette | 2018 | silt loam | 4.46m × 9.14m | conventional | furrow | BTS251N | 8 |
| Fruitland, Payette | 2019 | silt loam | 2.23m × 9.14m | conventional | furrow | BTS251N | 6 |
| Kimberly, Twin Falls | 2019 | silt loam | 2.23m × 9.14m | conventional | solid set sprinkler | BTS251N | 7 |
| Paul, Minidoka | 2019 | silt loam | 2.23m × 9.14m | conventional | wheel line | BTS251N | 6 |
Table 2. Site soil sampling and N fertilizer information.
| City, County | Year | Residual Soil N Supply | Fertilizer N Rates | Total N Supplies |
| kg N ha-1 | ||||
| Jerome, Jerome | 2018 | 146 | 0, 28, 56, 84, 112, 140, 168 | 146, 174, 202, 205, 230, 258, 286 |
| Kimberly, Twin Falls | 2018 | 101 | 0, 39, 67, 95, 123, 157, 213 | 101, 140, 168, 196, 224, 258, 314 |
| Payette, Payette | 2018 | 179 | 0, 22, 45, 67, 90, 112, 134 | 179, 202, 224, 246, 269, 291, 314 |
| Fruitland, Payette | 2019 | 133 | 0, 28, 56, 84, 112, 140, 168 | 133, 161, 189, 217, 245, 273, 301 |
| Kimberly, Twin Falls | 2019 | 80 | 0, 65, 92, 121, 148, 176, 244 | 80, 145, 172, 201, 227, 255, 324 |
| Paul, Minidoka | 2019 | 143 | 0, 28, 56, 84, 112, 140, 168 | 143, 171, 199, 227, 255, 283, 311 |
N Application
Prior to N fertilizer treatment applications in spring, one soil core was taken in each plot in 0.3 m increments to a depth of 0.9 m. Soil samples were analyzed for nitrate-N (NO3-N) and ammonium-N (NH4-N) after extraction in 2M KCl (Mulvaney, 1996) using a flow injection analyzer (Lachat Instruments, Loveland, CO). At each site, the 0-0.9 m NO3-N and NH4-N in was averaged across all cores to determine site N supply.
At each site, 7 N fertilizer rates were chosen to provide a range of N supplies that enabled the entire response function to be captured (Table 2). For all sites, N was applied as urea fertilizer and immediately incorporated using conventional tillage.
Harvest and Analysis
Root yield was measured from each plot using a load cell scale mounted to a plot harvester. From the roots harvested, two samples (at least 12 kg each) were bagged and analyzed at the ASCO tare lab for percent sugar, nitrate concentration, and electrical conductivity. Percent sugar was determined using an Autopol 880 polarimeter (Rudolph Research Analytical, Hackettstown, NJ), a half-normal weight sample dilution, and aluminum sulfate clarification method [ICUMSA Method GS6-3 1994] (Bartens, 2005). Conductivity was measured using a Foxboro conductivity meter Model 871EC (Foxboro, Foxboro, MA) and nitrate was measured using a Model 250 multimeter (Denver Instruments, Denver, CO) with Orion probes 900200 and 9300 BNWP (Krackler Scientific, Inc., Albany, NY). Recoverable sucrose yield per ton of roots was estimated by: [(percent extraction)(0.01)(gross sucrose/ha)]/(t/ha), where percent extraction = 250 + [[(1255.2)(conductivity) – (15000)(percent sucrose – 6185)]/[(percent sucrose)(98.66 – [(7.845)(conductivity)])] ] and gross sucrose (t/ha) = (gross root yield, t/ha)(percent sucrose)(0.01)(1000 kg/t).
Statistical Analysis and Calculations
Statistical analyses were conducted separately for each site. Analysis of variance was conducted for N supply treatment main effects on selected production factors (sucrose yield, root yield, N use efficiency, N requirement, root sucrose concentration, and root brei nitrate concentration) using a randomized block design model in Statistix 8.2 (Analytical Software, Tallahassee, FL). Nitrogen use efficiency was defined as the quantity of sucrose produced per kg N supply (fertilizer N + spring soil residual inorganic N). Nitrogen requirement was defined as the kg N supply per Mg of harvested sugarbeet root.
For site-years with significant N supply main effects on ERS yield, the maximum ERS yield was determined by comparing adjacent numerically ordered means using the least significant difference method (LSD) at the 0.05 probability level. For each site-year with no significant N supply main effect on ERS yield, the data was not included when assessing N management strategies.
Results and Discussion
Yield and NUE
Across all sites, N supply had a significant effect on many of the yield and NUE factors (Table 3 and Table 4). The effects of N supply on root yield were significant for 5 of the 6 sites, and for sucrose yield in 4 of the 6 years (Table 3 and Table 4). For these sites, yields increased with N supply to the maximum yield than higher N supplies did not increase yield (quadratic type response). The N supplies at maximum sucrose and root yields at each site were bolded in Table 3 and Table 4 and averaged 203 kg N ha-1 (range = 145 to 258 kg N ha-1). Across sites, maximum sucrose and root yield ranged from 12.6 to 21.1 Mg sucrose ha-1 and 82.8 to131.2 Mg roots ha-1 respectively. The average root yield across all sites and N supply treatments was 96.3 Mg roots ha-1. This was 7% greater than the average yield for all commercial fields in Idaho during 2018 and 2019 (89.1 Mg roots ha-1) (Figure 1). Nitrogen supply had significant effects on NUE at all sites (Table 3 and Table 4). For the 6 sites NUE was highly correlated to N supply (Figure 2). The NUE decreased as N supply increased. The NUE at the mean N supply at maximum yield was 75.2 kg sucrose kg-1 N. This was a higher NUE compared to the 2005 to 2011 data set (60.3 kg sucrose kg-1 N) (Tarkalson et al., 2016).
Table 3. 2018 mean site estimated recoverable sucrose yield, root yield, and nitrogen requirement (Nr) for N supply treatments. Analysis of variance for relationships between N supply and measurements. The least significant difference (LSD) method was used to compare numerically adjacent ERS yields to determine maximum sucrose or root yields (N supply at maximum sucrose or root yield is bolded). Significance is the 0.05 level.
| City, County | N Supply † | Sucrose Yield | Root Yield | NUE | Nr | Root Sucrose | Root Nitrate | Root Conductivity |
| kg ha-1 | Mg ha-1 | Mg ha-1 | kg sucrose kg-1 N | kg Mg-1 | % | mg kg-1 | mmhos cm-1 | |
| Jerome, Jerome | 146 | 19.0 c | 116.7 b | 130.6 a | 1.2 e | 18.7 | 42.0 | 0.60 |
| 174 | 19.3 c | 117.7 b | 110.9 b | 1.5 d | 18.7 | 40.2 | 0.57 | |
| 202 | 19.2 c | 118.7 b | 95.2 c | 1.7 c | 18.6 | 43.0 | 0.62 | |
| 230 | 19.6 bc | 120.6 b | 85.5 d | 1.9 b | 18.6 | 41.4 | 0.58 | |
| 258 | 21.1 abc | 131.2 ab | 82.0 d | 2.0 b | 18.5 | 41.4 | 0.61 | |
| 286 | 20.2 ab | 126.1 a | 70.6 e | 2.3 a | 18.4 | 55.1 | 0.61 | |
| 314 | 21.5 a | 133.3 a | 68.4 e | 2.4 a | 18.5 | 62.6 | 0.59 | |
| p>f | 0.033 | 0.009 | <0.001 | <0.001 | 0.405 | 0.059 | 0.250 | |
| Kimberly, Twin Falls | 101 | 15.6 | 94.0 | 154.6 a | 1.1 g | 18.9 | 62.6 | 0.57 |
| 140 | 16.0 | 98.1 | 114.2 b | 1.4 f | 18.7 | 61.3 | 0.59 | |
| 168 | 16.1 | 96.8 | 95.8 c | 1.7 e | 18.9 | 48.0 | 0.54 | |
| 196 | 16.3 | 98.1 | 83.3 d | 2.0 d | 18.8 | 58.8 | 0.53 | |
| 224 | 16.5 | 100.8 | 73.6 d | 2.2 c | 18.6 | 32.0 | 0.56 | |
| 258 | 16.0 | 98.2 | 62.3 e | 2.6 b | 18.5 | 58.0 | 0.53 | |
| 314 | 16.6 | 101.3 | 46.2 f | 3.5 a | 18.6 | 66.6 | 0.55 | |
| p>f | 0.812 | 0.608 | <0.001 | <0.001 | 0.840 | 0.824 | 0.587 | |
| Payette, Payette | 179 | 10.9 c | 65.2 c | 60.7 ab | 2.7 bcd | 18.6 | 26.6 | 0.44 |
| 202 | 13.0 b | 78.6 b | 64.4 a | 2.6 d | 18.5 | 26.6 | 0.46 | |
| 224 | 13.7 ab | 82.8 ab | 61.0 a | 2.7 cd | 18.5 | 22.1 | 0.44 | |
| 246 | 12.9 b | 77.7 b | 45.7 c | 3.2 ab | 18.6 | 21.7 | 0.44 | |
| 269 | 13.8 ab | 84.4 ab | 51.5 bc | 3.2 abc | 18.4 | 27.1 | 0.44 | |
| 291 | 14.8 a | 90.5 a | 50.9 c | 3.2 abc | 18.4 | 23.2 | 0.45 | |
| 314 | 13.5 ab | 82.8 ab | 43.2 c | 3.8 a | 18.4 | 26.1 | 0.44 | |
| p>f | <0.001 | <0.001 | <0.001 | 0.002 | 0.960 | 0.785 | 0.746 |
Table 4. 2019 mean site estimated recoverable sucrose yield, root yield, and nitrogen requirement (Nr) for N supply treatments. Analysis of variance for relationships between N supply and measurements. The least significant difference (LSD) method was used to compare numerically adjacent ERS yields to determine maximum sucrose or root yields (N supply at maximum sucrose or root yield is bolded). Significance is the 0.05 level.
| City, County | N Supply † | Sucrose Yield | Root Yield | NUE | Nr | Root Sucrose | Root Nitrate | Root Conductivity |
| kg ha-1 | Mg ha-1 | Mg ha-1 | kg sucrose kg-1 N | kg Mg-1 | % | mg kg-1 | mmhos cm-1 | |
| Fruitland, Payette | 133 | 11.6 | 77.1 b | 86.9 a | 1.7 d | 17.1 | 33.7 | 0.55 |
| 161 | 11.6 | 77.7 b | 71.6 b | 2.1 cd | 17.0 | 45.3 | 0.55 | |
| 189 | 12.6 | 84.9 ab | 66.6 bc | 2.2 c | 17.0 | 40.3 | 0.55 | |
| 217 | 13.4 | 91.1 a | 61.8 cd | 2.4 c | 16.8 | 56.5 | 0.53 | |
| 245 | 13.1 | 89.8 a | 53.5 de | 2.7 b | 16.8 | 55.6 | 0.56 | |
| 273 | 13.3 | 90.5 a | 48.6 ef | 3.0 b | 16.8 | 47.3 | 0.57 | |
| 301 | 13.2 | 89.5 a | 43.7 f | 3.4 a | 16.8 | 42.7 | 0.54 | |
| p>f | 0.060 | 0.040 | <0.001 | <0.001 | 0.283 | 0.165 | 0.825 | |
| Kimberly, Twin Falls | 80 | 13.4 b | 81.1 b | 168.0 a | 1.0 g | 18.6 bcd | 34.0 | 0.51 |
| 145 | 14.9 a | 89.4 a | 103.3 b | 1.6 f | 18.9 ab | 40.0 | 0.51 | |
| 172 | 15.2 a | 90.9 a | 88.4 c | 1.9 e | 18.9 abc | 33.1 | 0.51 | |
| 201 | 15.0 a | 89.4 a | 74.7 d | 2.2 d | 19.0 a | 39.3 | 0.51 | |
| 227 | 14.9 a | 91.3 a | 65.5 e | 2.5 c | 18.5 d | 41.8 | 0.53 | |
| 255 | 15.1 a | 91.9 a | 59.2 e | 2.8 b | 18.6 cd | 51.0 | 0.52 | |
| 324 | 14.6 a | 89.3 a | 45.0 f | 3.6 a | 18.5 d | 50.1 | 0.51 | |
| p>f | <0.001 | <0.001 | <0.001 | <0.001 | 0.002 | 0.248 | 0.900 | |
| Paul, Minidoka | 143 | 13.3 c | 85.4 c | 93.0 a | 1.7 f | 18.1 | 38.0 | 0.66 |
| 171 | 14.8 b | 94.6 b | 86.3 b | 1.8 fe | 18.1 | 36.1 | 0.64 | |
| 199 | 16.2 a | 103.1 a | 81.4 b | 1.9 e | 18.1 | 44.7 | 0.62 | |
| 227 | 16.7 a | 107.2 a | 73.3 c | 2.1 d | 18.0 | 54.9 | 0.67 | |
| 255 | 16.7 a | 106.0 a | 65.4 d | 2.4 c | 18.1 | 42.3 | 0.61 | |
| 283 | 16.8 a | 106.7 a | 59.2 de | 2.7 b | 18.1 | 53.4 | 0.64 | |
| 311 | 16.6 a | 104.5 a | 53.2 e | 3.0 a | 18.2 | 51.0 | 0.62 | |
| p>f | <0.001 | <0.001 | <0.001 | <0.001 | 0.820 | 0.333 | 0.577 |
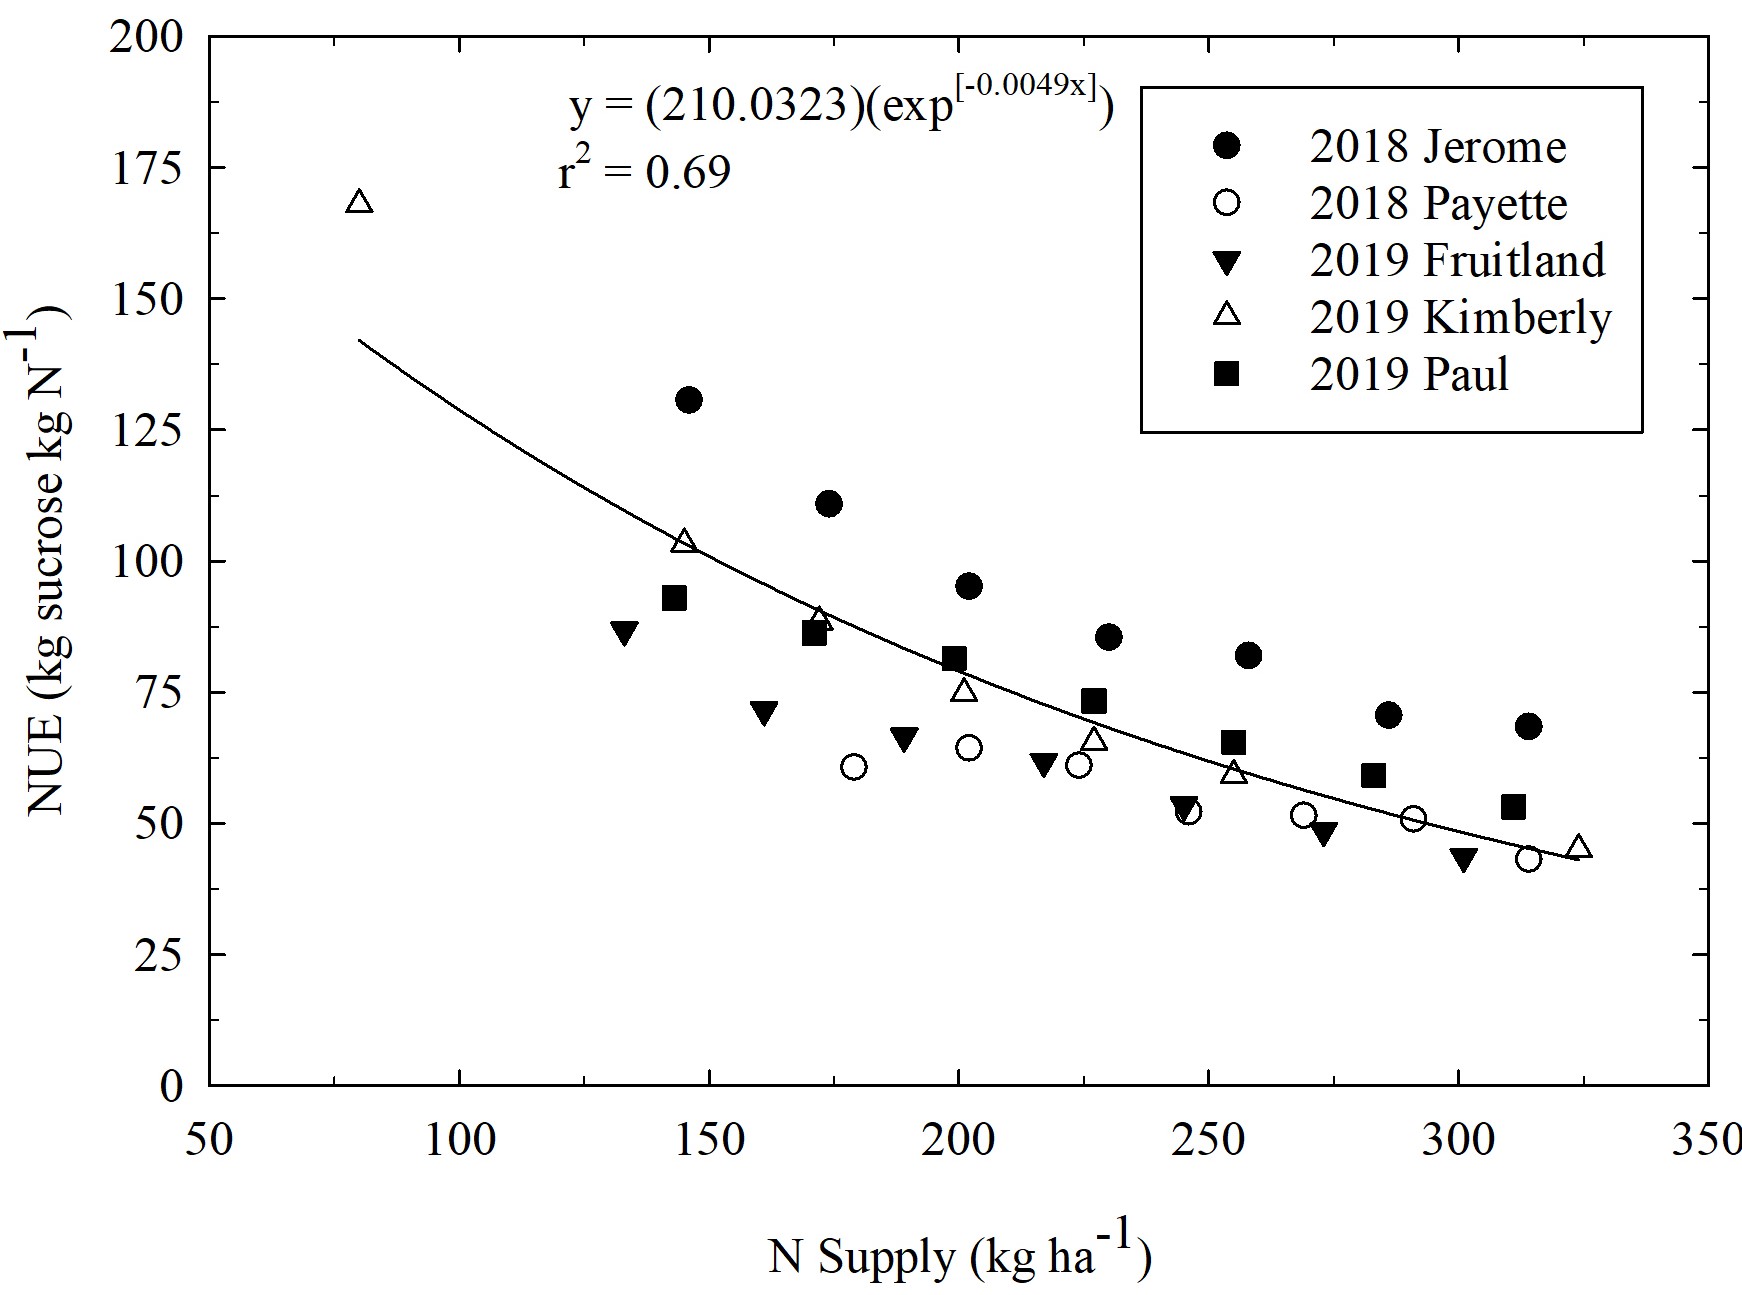
Figure 2. Sugarbeet N use efficiency (NUE) versus N supply for site years with significant N supply main effects (Table 3 and Table 4). Regression model was fit to all data. Points represent individual plot values
Root Quality
Across all sites, N supply had no effect on most quality factors (root sucrose percentage, nitrate and conductivity) (Table 3 and Table 4). The exception was the 2019 Kimberly site where root sucrose percentage was significantly greater at 201 kg N ha-1 N supply. Although, all N supplies at the site had high sucrose concentrations (>18%). Across all sites and N supplies the average root sucrose percentage, nitrate concentration, and conductivity was 18.2%, 42.3 mg kg-1, and 0.55 mmhos cm-1 (Table 3 and Table 4). Root nitrate is a measure of N related impurities in sugarbeet roots and has been related to reduced sucrose concentrations and decreased sucrose extraction. Root nitrate can be higher under increase N rates (Tarkalson, et a., 2016). Guidelines from ASCO state that sucrose concentration decreases by approximately 0.5% for every 100 mg nitrate kg over 200 mg nitrate kg-1 (Tarkalson et al., 2016). Across all sites and N supply treatments (up to 324 kg N ha-1), the greatest root nitrate concentration was 66.6 mg kg-1 well lower than the critical level that affects root sucrose percentage (Table 3 and Table 4).
Static Range vs Yield Goal N Management
The N requirement (Nr) factor and a field specific yield goal are the two components of the YGNM approach: YGNM Recommended N supply (kg N ha-1) = Nr (kg N Mg-1 root) × yield goal (Mg ha-1) Eq. 1The recommended N supply is a combination of plant available inorganic N (NO3-N + NH4-N) in the soil and fertilizer N.
When recommended N supplies to maximize yields are relatively static over time, the Nr factor in in Eq. 1 has to decrease because sugarbeet root yields are increasing over time (Figure 1). Findings of Tarkalson et al. (2016) and Tarkalson et al. (2018) showed that Nr values have decreased over time. Research concluded around 1977, 1997, 2011 had Nr calculated at 4.0, 3.7, and 2.75 kg N Mg-1 roots. By comparison, our study calculated the Nr value at 2.1 kg N Mg-1 roots, a continued decrease from previous studies. The declining Nr factors and increasing yields over time leads to the conclusion that a SRNM approach is valid. A YGNM approach will only accurately recommend N supplies over time if continuous research is conducted to provide updated Nr factors. However, time requirements, economic funding, and competing research objectives make this impractical. For a YGNM approach, if the Nr factor is not continually updated with research, YGNM N supply recommendations quickly exceed sugarbeet nutritional needs (Tarkalson et al., 2016; and Tarkalson et al., 2018). For example, from 1977 to 1994 the Nr factor of 4 kg N Mg-1 root (established in 1977) was used with average annual yields increasing from 44 Mg ha-1 to 63 Mg ha-1 (Figure 1), resulting in a YGNM N supply recommendation of 176 kg N ha-1 to 252 kg N ha-1, respectively. In Tarkalson et al. (2016) and in our study, the average N supply needed to maximize yield was 202 and 203 kg N ha-1, respectively (Table 5). These N supplies to reach maximum root yields were approximately 49 kg N ha-1 (252 kg N ha-1 – 203 kg N ha-1) less than the YGNM N supply recommendation in 1994, although the average yield in 2018 was 28 Mg ha-1 higher than in 1994. If the Nr factor of 4 kg N Mg-1 root was used in 2018, the YGNM N supply recommendation would have been 364 kg N ha-1, 161 kg N ha-1 (364 kg N ha-1 – 203 kg N ha-1) greater than needed to maximize yield. In 2022, this excess N would cost $354 ha-1 (Figure 3).
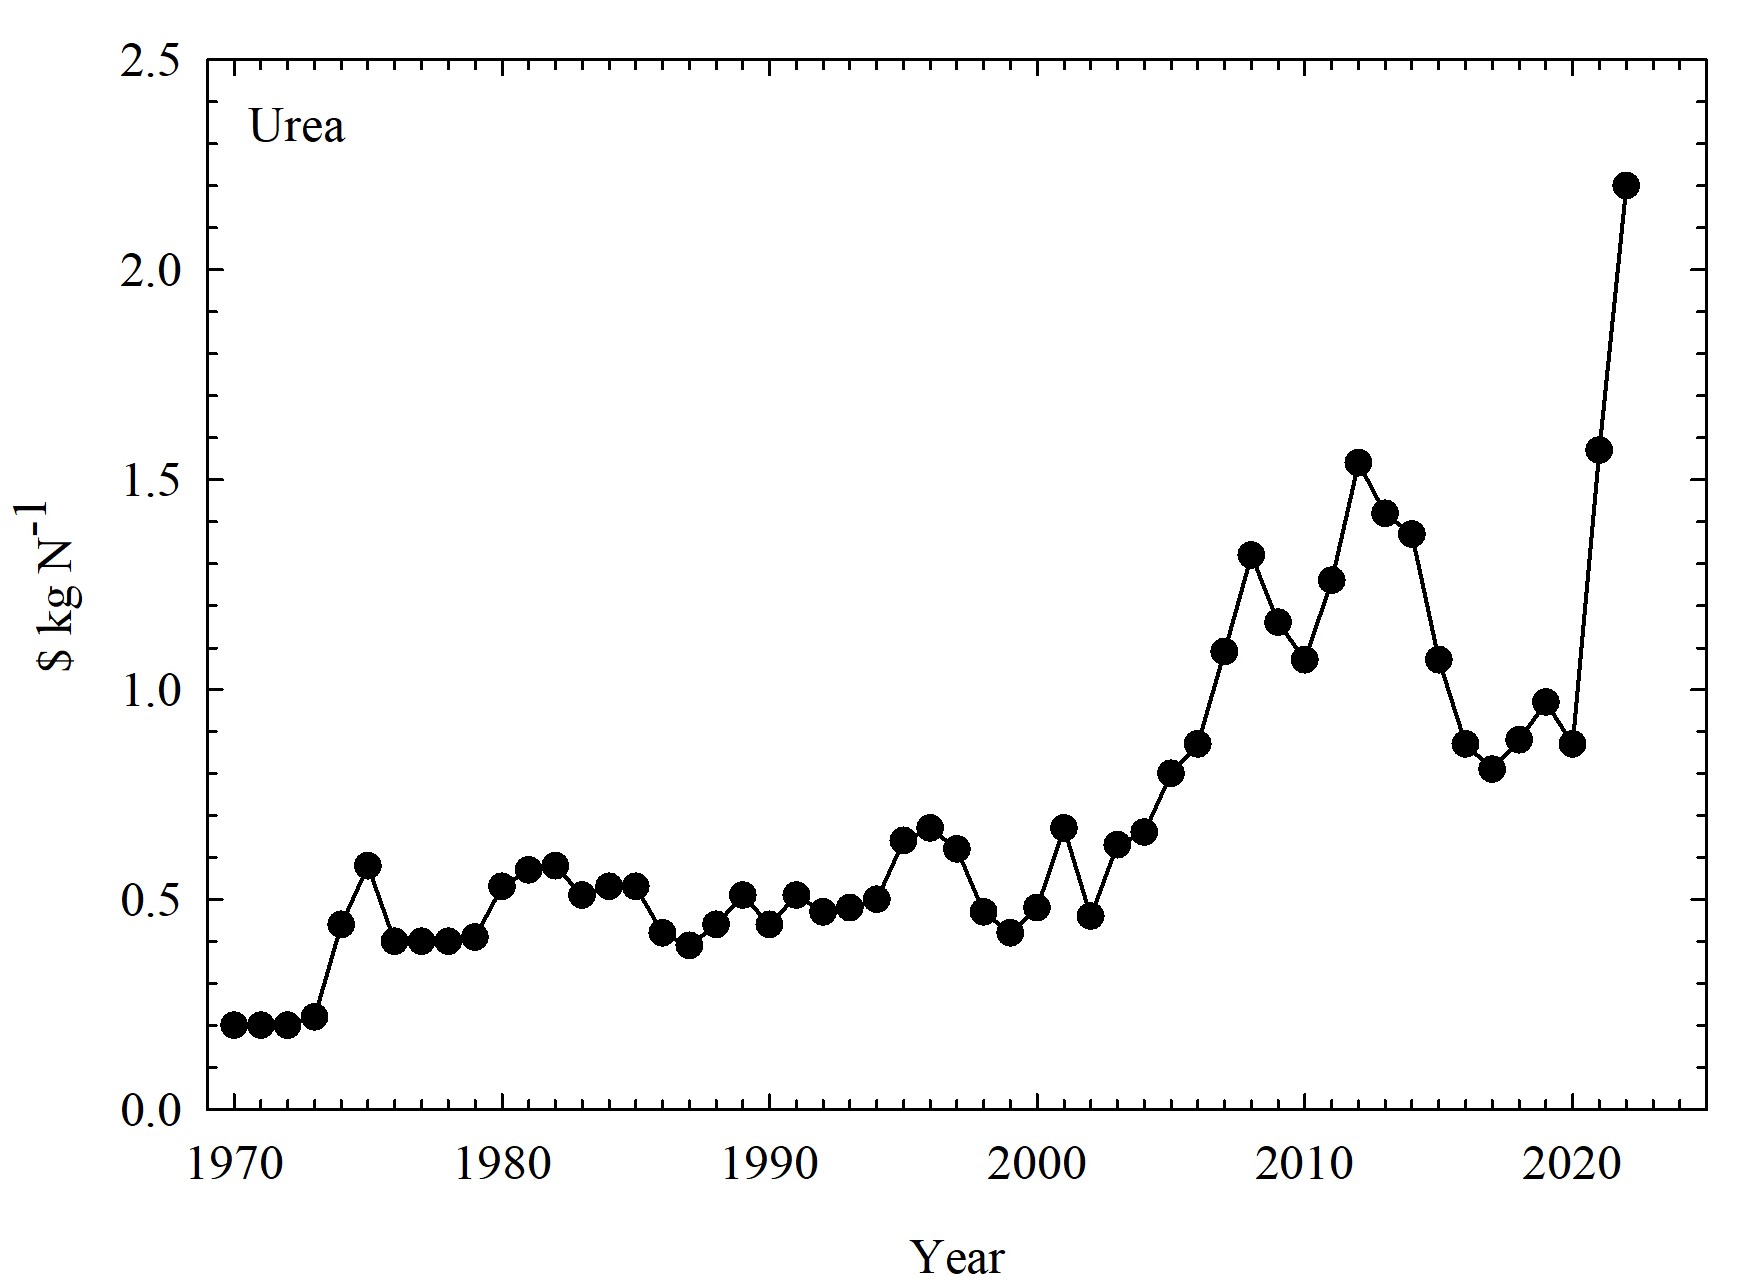
Figure 3. Average annual urea N price over time in the U.S
Table 5. Average maximum root yields, N supplies at the maximum root yields, N requirement, and range of N supplies at maximum root yields for Tarkalson et al. 2016 and this study.
| Study Years | Study Sources | Average Maximum Root Yield | Average N Supply at Maximum Root Yield | Average Nr | Range of N Supplies at Maximum Root Yield for Study Sites |
| Mg ha-1 | kg ha-1 | kg Mg-1 | kg ha-1 | ||
| 2005-2010 | USDA–ARS and Amalgamated Sugar Co. † | 77 | 202 | 2.7 | 179, 169, 205, 218, 237 |
| 2018-2019 | USDA–ARS and Amalgamated Sugar Co. ‡ | 99 | 203 | 2.1 | 145, 199, 189, 224, 258 |
| † Tarkalson et al. (2016). Data from site-years with statistically significant relationships between N supply and root yield (p = 0.05).
‡ This study (Tables 3 and Table 4). Data from site-years with statistically significant relationships between N supply and root yield (p = 0.05). |
|||||
The data in our study supports the conclusions of Tarkalson et al. (2016) the SRNM strategy is valid, and over time will reduce over supplying N when using a YGNM approach. If yields continue to increase, the updated Nr value of 2.1 will result in over recommending N supply. The SRNM approach will better predict required N supplies to maximize sugarbeet yields while not requiring continued research to update Nr factors. Periodic studies can be conducted to evaluate the needed adjustments in the SRNM approach.
Sugarbeet Yields and N Prices Over Time
Because the YGNM approach links sugarbeet yield with N supply requirements, changes in yields and N prices have significant effects on production economics. The average sugarbeet yields in the Northwest U.S. have continually increased over and urea N price has increased by 30% over the last decade (2012-2022) (Figure 3). If a YGNM approach leads to over supplying N to sugarbeet over time, higher N prices can have an increasingly negative economic impact for producers.
CONCLUSIONS
This study supports past research showing that a SRNM approach is valid. The average N supply required to maximize sugarbeet yields in our study and in a previous research study (Table 5) differed by only 1 kg N ha-1, even though root yields in our study were 12 Mg ha-1 greater. Data shows that YGNM approach leads to an over-supply of N over time. This over supply of N can have negative environmental and economic consequences, especially as N prices continue to increase. Sugarbeet growers should evaluate the needed N supplies to maximize yields in their growing area and follow a SRNM approach. Continued research over time can fine tune SRNM.
REFERENCES
Bartens, A., 2005. International Commission for Uniform Methods of Sugar Analysis Methods Book 2005. p. 431. Dr. Albert Bartens KG, Berlin, Germany.
Carter, J.N. and D.J. Traveller. 1981. Effect of time and amount of nitrogen uptake on sugarbeet growth and yield. Agron. J. 73:665-671.
James, D.W., A.W. Richards, W.H. Weaver, and R.L. Reeder. 1971. Residual soil nitrate measurement as a basis for managing nitrogen fertilizer practices for sugarbeets. J. Amer. Soc. Sug. Beet Tech. 16:313-322.
King, B.A., Tarkalson, D.D. 2017. Irrigated sugarbeet sucrose content in relation to growing season climatic conditions in the Northwest U.S. Journal of Sugar Beet Research. 54:60-74.
Mulvaney, R.L. 1996. Nitrogen-inorganic forms. p. 1123-1184. In D.L. Sparks (ed.) Methods of soil analysis: Part 3. SSSA Book Ser. 5. SSSA, Madison, WI.
Tarkalson, D.D., and Bjorneberg, D.L. 2018. Is static nitrogen management in Northwest U.S. sugar production appropriate? Agriculture & Environmental Letters. doi: 10.2134/ael2018.01.0001.
Tarkalson, D.D., D.L. Bjorneberg, S. Camp, G. Dean, D. Elison and R. Foote. 2016. Improving nitrogen management in Pacific Northwest sugarbeet production. J of Sugar Beet Res. 53:14-36. 2016.
USDA-NASS, 2022 Online: https://www.nass.usda.gov/ (Accessed 10 October 2022).
ACKNOWLEDGEMENTS
This research was supported by the U.S. Department of Agriculture, Agricultural Research Service. Mention of trade names or commercial products in this article is solely for the purpose of providing specific information and does not imply recommendation or endorsement by the U.S. Department of Agriculture. The USDA is an equal opportunity employer.