Introduction
Nitrogen (N) management is important in sugarbeet production because it can affect both yields and quality (Stout, 1960; Tarkalson et al., 2016). Under supplying N can reduce yields while over supplying N often results in decreased root sucrose content and increased root impurities which decreases sucrose extraction efficiency (Carter and Traveller, 1981; James et al. 1971). In addition, over supplying N can lead to increased N losses to the environment and represents an unnecessary cost to the grower. Because of the importance of optimizing N supply for sugarbeet production and due to the continuing trend for increasing yields, research studies have been conducted periodically in the Northwest U.S. sugarbeet growing area to determine sugarbeet N requirement.
The sugarbeet production in the Pacific Northwest is located primarily from south central Idaho to southeastern Oregon. Beets are produced by growers who are part of TASCO, a grower-owned cooperative. From 2011 to 2020 an average of 73,700 ha year-1 of sugarbeets were harvested in this growing area (NASS, 2022).
Historically in the Northwest U.S. sugarbeet growing area, a yield goal N management (YGNM) approach has been utilized to determine fertilizer N requirement. The basis of YGNM was to determine the total available soil N supply [soil (0-0.9 m) NO3-N and NH4-N + fertilizer N] needed to optimize sucrose and root yields. However, recent data analysis and research in the Northwest U.S. growing area has indicated that a YGNM approach can lead to over supplying N over time and a static N range approach may better match sugarbeet N supply needs (Tarkalson et al., 2016a; Tarkalson et al. 2018; Tarkalson, Olsen, Bjorneberg, in submission, this issue). Improvements in N management practices that better match N supply with crop need will improve production economics and reduce negative environmental impacts. The YGNM approach is based on research derived N requirement factors (Nr) multiplied by site-specific root yield goals. The Nr factor represent the Mg of N needed to grow a Mg of sugarbeet roots (kg N Mg-1 roots). Research from Tarkalson et al. (2016a) showed that the Nr factor (2.75-3.0 kg N Mg-1 roots) was lower than previously research derived Nr factors (3.5 to 4.0 kg N Mg-1 roots) (Tarkalson et al., 2018). It was determined that the decrease in Nr was likely due to increasing yields over time (Figure 1) and a relatively stable crop N supply requirement. This observation was highlighted in Tarkalson et al. (2018) and led to research in Tarkalson, Olsen, Bjorneberg (in submission, this issue). Tarkalson, Olsen, Bjorneberg (in submission, this issue) found that the N supply required to maximize yields in research plots in 2018 and 2019 (209 kg N ha-1) were similar to N supplies required in research studies conducted from 2005 to 2010 (202 kg N ha-1), even when the root yields increased by 22% over the time between the research studies. Prior to major adjustments in the Northwest U.S. sugarbeet growing area, additional research was needed fine-tune comparisons of the SRNM with other N management approaches.
The objective of this study was to compare surgarbeet yield and quality factors using a SRNM, YGNM, and a commonly used agricultural consultant business (ACB) N management approach in the Northwest U.S.
Materials and Methods
Site Characteristics
The studies in this paper were conducted in 2020 and 2021 at 6 research sites (Table 1). The sites ranged across the southern Idaho sugarbeet production area. All sites had the same tillage practices (conventional), spring soil sample depth (0-0.9 m), row spacing (0.56 m), N source (urea), and timing of N application (4 to 6 leaf stage) (Table 1). Research has shown that the 4 to 6 leaf stage is the start of significant crop N uptake (TASCO, 2020). Other cultural and experimental practices varied across sites (plot size, N application rate, treatment replications, irrigation system, planting date, glyphosate application timings, planting date, and harvest date) (Table 1).
Table 1. Site information for the Idaho study sites.
| Site-Year | City, County | Year | Soil Texture | Plot Size | Irrigation System | Variety | No. Treatment Replications | Plant Date | Harvest Date |
| 1 | Jerome, Jerome | 2020 | loam | 3.4m ×11.1m | wheel line | BTS 251N | 6 | Apr 17 | Oct 5 |
| 2 | Nampa, Canyon | 2020 | silt loam | 3.4m × 7.3m | drip | BTS 251N | 6 | Mar 24 | Oct 5 |
| 3 | Fruitland, Payette | 2020 | silt loam | 3.4m × 7.3m | furrow | BTS 251N | 6 | Apr 13 | Sept 30 |
| 4 | Burley, Minidoka | 2021 | silt loam | 3.4m × 10.5m | wheel line | Crystal A702NT | 8 | Apr 7 | Oct 7 |
| 5 | Jerome, Jerome | 2021 | silt loam | 3.4m × 10.2m | wheel line | Crystal A702NT | 8 | Apr 3 | Sep 28 |
| 6 | Nampa, Canyon | 2021 | silt loam | 3.4m × 7.3m | drip | Crystal A702NT | 8 | Apr 1 | Sept 27 |
N Application
Prior to N fertilizer treatment applications in spring, 4 cores were taken in each rep to a depth of 0.9 m in 0.03 m depth increments. Soil samples were analyzed for nitrate-N (NO3-N) and ammonium-N (NH4-N) after extraction in 2M KCl (Mulvaney, 1996) using a flow injection analyzer (Lachat Instruments, Loveland, CO). At each site, the 0-0.9 m NO3-N and NH4-N in was averaged across all cores to determine site N supply.
Six N supply treatments (fertilizer N + residual inorganic soil N [NO3-N + NH4N]) were applied and replicated 6 times in 2020 and 8 times in 2021 and arranged in a randomized block design. The treatments were a control (no fertilizer N), SRNM low range rate, SRNM medium range rate, SRNM high range rate, YGNM rate, and a ACB N supply recommendation. Treatment N supply specifics are detailed in Table 2. The SRNM treatments were based on past research studies (Tarkalson et al, 2016; Tarkalson, Olsen, Bjorneberg, in submission, this issue). For the YGNM treatment, the N supply recommendation are based on current published recommendations (TASCO, 2020; Tarkalson et al., 2016b). The site YGNM calculations were:
YGNM N Supply (kg N ha-1) = Nr (kg N supply Mg-1 root) × Yield Goal (Mg roots ha-1)
Site 1 YGNM N supply (kg N ha-1) = 3 kg N supply Mg-1 root × 92 Mg roots ha-1
Site 2 YGNM N supply (kg N ha-1) = 2.75 kg N supply Mg-1 root × 114 Mg roots ha-1
Site 3 YGNM N supply (kg N ha-1) = 2.75 kg N supply Mg-1 root × 119 Mg roots ha-1
Site 4 YGNM N supply (kg N ha-1) = 3 kg N supply Mg-1 root × 101 Mg roots ha-1
Site 5 YGNM N supply (kg N ha-1) = 3 kg N supply Mg-1 root × 92 Mg roots ha-1
Site 6 YGNM N supply (kg N ha-1) = 2.75 kg N supply Mg-1 root × 112 Mg roots ha-1
Yield Goals are based on actual root yields over the previous 5 years (2015-2019 average) from the site area. Any slight variations in calculations above and values in Table 2 are due to rounding errors.
A subsample of the spring soil samples and yield goals (same as for YGNM treatments) from each site were sent to a ACB for analysis and a N fertilizer recommendation. The ACB N recommendations are proprietary, so we have no information on the calculations. However, when multiplying the ACB recommended N supplies by the yield goals, the Nr factors range from 6.5 to 6.8 kg N supply Mg-1 root. For all sites, N treatments were applied as urea fertilizer and immediately incorporated using conventional tillage.
Harvest and Analysis
Root yield was measured in each plot using a load cell scale mounted to a plot harvester. Three samples per plot (each at least 12 kg of harvested roots) were collected and analyzed at the TASCO tare lab for percent sugar, nitrate concentration, and electrical conductivity. Percent sugar was determined using an Autopol 880 polarimeter (Rudolph Research Analytical, Hackettstown, NJ), a half-normal weight sample dilution, and aluminum sulfate clarification method [ICUMSA Method GS6-3 1994] (Bartens, 2005). Conductivity was measured using a Foxboro conductivity meter Model 871EC (Foxboro, Foxboro, MA) and nitrate was measured using a Model 250 multimeter (Denver Instruments, Denver, CO) with Orion probes 900200 and 9300 BNWP (Krackler Scientific, Inc., Albany, NY). Recoverable sucrose yield per ton of roots was estimated by: [(percent extraction)(0.01)(gross sucrose/ha)]/(t/ha), where percent extraction = 250 + [[(1255.2)(conductivity) – (15000)(percent sucrose – 6185)]/[(percent sucrose)(98.66 – [(7.845)(conductivity)])] ] and gross sucrose (t/ha) = (gross root yield, t/ha)(percent sucrose)(0.01)(1000 kg/t).
Statistical Analysis and Calculations
Statistical analyses were conducted separately for each site. Analysis of variance was conducted for N supply treatment main effects on the selected production factors of sucrose yield, root yield, N use efficiency, N requirement, root sucrose percent, and root brei nitrate concentration using a randomized block design model in Statistix 8.2 (Analytical Software, Tallahassee, FL). Nitrogen use efficiency was defined as the quantity of sucrose produced per kg N supply (fertilizer N + spring soil residual inorganic N). Nitrogen requirement was defined as the kg N supply per Mg of harvested sugarbeet root.
For site-years with significant N supply main effects on root and sucrose yield, the maximum yield was identified by comparing adjacent numerically ordered means using the least significant difference method (LSD) at the 0.05 probability level. For each site-year with no significant N supply main effect on yields, the yield for the control treatment was considered the maximum yield.
For fertilizer economic calculations, mean Urea prices over the past 5 years (2018-2022) were used (DTN, 2022).
Table 2. Site-year yield and N treatment information for sugarbeet at the Idaho study sites.
| Site-Year | No. Treatment Replications | Field 5-Year Root Yield Average | Idaho 5-Year Root Yield Average | Control | SRNM† Low | SRNM Med | SRNM High | YGNM‡ | ACB⁋ |
| ———–Mg ha-1———– | ———————kg N Supply ha-1 (kg N Fertilizer ha-1) ——————— | ||||||||
| 1 | 6 | 92 | 90 | 132(0) | 202(69) | 230(97) | 258(125) | 276(143) | 298(166) |
| 2 | 6 | 114 | 90 | 196(0) | 202(6) | 230(34) | 258(62) | 314(118) | 372(176) |
| 3 | 6 | 119 | 90 | 137(0) | 202(65) | 230(93) | 258(121) | 328(192) | 394(258) |
| 4 | 8 | 101 | 90 | 148(0) | 202(54) | 230(82) | 258(110) | 302(155) | 336(188) |
| 5 | 8 | 92 | 90 | 174(0) | 202(28) | 230(56) | 258(84) | 274(101) | 314(140) |
| 6 | 8 | 112 | 90 | 218(0) | 218(0) | 230(11) | 258(39) | 308(90) | 381(162) |
| † SRNM = Static Range N Management
‡ YGNM = Yield Goal N Management. Nr = 2.75 to 3 kg N Mg-1 root yield goal (TASCO, 2020; Tarkalson et al. 2016a; Tarkalson et al. 2016b). ⁋ACB = Agricultural Consultant Business. |
|||||||||
Table 3. Site-year root yield, sucrose yield, nitrogen use efficiency (NUE), root sucrose percent, root nitrate concentration, root conductivity, and root juice purity (PJTP) concentration. Analysis of variance (ANOVA) for relationships between N supply and the listed measurements is shown. For significant ANOVA main effects (p< 0.05), the least significant difference (LSD) method was used to compare numerically adjacent measurements. For maximum root or sucrose yields, treatment ID’s and maximum yield N rates (MYNR) are bolded. For studies with no significant relationships between N supply and yields, the control is considered the maximum treatment.
| SiteYear | Treatment ID | N Supply | Root Yield | Sucrose Yield | NUE | Root Sucrose | Root Nitrate | Root Conductivity | PJTP |
| kg ha-1 | kg ha-1 | Mg ha-1 | Mg ha-1 | kg sucrose kg-1 N | % | mg kg-1 | mmhos cm-1 | % | |
| 1 | Control | 132 | 96.6 b | 16.6 b | 125.6 a | 19.7 | 35.2 | 0.63 | 94.9 |
| SRNM Low | 202 | 111.2 a | 18.9 a | 93.6 b | 19.6 | 30.4 | 0.64 | 94.9 | |
| SRNM Med | 230 | 115.8 a | 19.7 a | 85.9 c | 19.5 | 26.5 | 0.60 | 95.0 | |
| SRNM High | 258 | 114.8 a | 19.5 a | 76.6 d | 19.4 | 29.5 | 0.59 | 95.1 | |
| YGNM | 276 | 115.3 a | 19.5 a | 70.8 de | 19.4 | 28.4 | 0.60 | 95.0 | |
| ACB | 298 | 116.4 a | 19.5 a | 65.6 e | 19.3 | 32.7 | 0.61 | 94.9 | |
| p>f | 0.001 | <0.001 | <0.001 | 0.092 | 0.647 | 0.657 | 0.698 | ||
| 2 | Control | 196 | 136.5 | 19.1 | 97.5 a | 17.2 | 365.7 | 0.99 | 91.4 |
| SRNM Low | 202 | 133.0 | 18.2 | 90.5 b | 16.8 | 433.3 | 0.99 | 91.0 | |
| SRNM Med | 230 | 136.0 | 18.6 | 81.2 c | 16.8 | 430.0 | 1.00 | 91.0 | |
| SRNM High | 258 | 136.5 | 19.2 | 74.5 d | 17.0 | 412.0 | 0.92 | 91.4 | |
| YGNM | 314 | 136.6 | 19.1 | 60.9 e | 16.9 | 386.9 | 0.93 | 91.5 | |
| ACB | 372 | 144.8 | 19.7 | 53.0 f | 16.9 | 449.8 | 1.08 | 90.5 | |
| p>f | 0.214 | 0.348 | <0.001 | 0.616 | 0.779 | 0.059 | 0.0391 | ||
| 3 | Control | 137 | 123.6 | 18.2 | 133.0 a | 16.9 | 130.8 | 0.61 | 94.3 |
| SRNM Low | 202 | 123.7 | 18.6 | 92.1 b | 17.1 | 118.6 | 0.54 | 94.7 | |
| SRNM Med | 230 | 122.7 | 18.2 | 79.4 c | 17.0 | 126.2 | 0.57 | 94.6 | |
| SRNM High | 258 | 118.0 | 17.3 | 68.2 d | 16.8 | 119.0 | 0.58 | 94.6 | |
| YGNM | 328 | 118.3 | 17.7 | 53.9 e | 17.1 | 135.2 | 0.55 | 94.6 | |
| ACB | 394 | 119.3 | 17.8 | 45.1 f | 17.0 | 124.7 | 0.55 | 94.7 | |
| p>f | 0.910 | 0.905 | <0.001 | 0.148 | 0.400 | 0.842 | 0.793 | ||
| 4 | Control | 146 | 91.3 c | 16.2 | 111.7 a | 20.2 a | 17.8 b | 0.57 | 95.2 |
| SRNM Low | 202 | 95.5 bc | 16.9 | 84.2 b | 20.1 a | 20.4 b | 0.57 | 95.2 | |
| SRNM Med | 230 | 105.5 ab | 18.6 | 80.4 b | 20.1 a | 20.2 b | 0.56 | 95.2 | |
| SRNM High | 258 | 103.9 ab | 18.4 | 71.2 c | 20.1 a | 22.9 b | 0.57 | 95.2 | |
| YGNM | 302 | 104.1 ab | 17.9 | 59.2 d | 19.7 b | 30.1 a | 0.59 | 95.0 | |
| ACB | 336 | 105.6 a | 18.2 | 54.2 d | 19.7 b | 30.3 a | 0.61 | 95.0 | |
| p>f | 0.014 | 0.054 | <0.001 | <0.001 | <0.001 | 0.177 | 0.082 | ||
| 5 | Control | 174 | 100.3 | 16.6 | 95.5 a | 19.1 | 26.3 b | 0.68 | 94.7 |
| SRNM Low | 202 | 103.6 | 16.8 | 83.3 b | 19.0 | 26.6 b | 0.69 | 94.7 | |
| SRNM Med | 230 | 103.0 | 16.8 | 73.1 c | 19.1 | 25.7 b | 0.70 | 94.6 | |
| SRNM High | 258 | 103.6 | 17.0 | 65.9 d | 19.0 | 27.7 ab | 0.68 | 94.7 | |
| YGNM | 274 | 102.9 | 16.8 | 61.2 e | 19.0 | 29.9 ab | 0.67 | 94.7 | |
| ACB | 314 | 103.5 | 16.6 | 53.0 f | 18.7 | 32.0 a | 0.71 | 94.5 | |
| p>f | 0.840 | 0.947 | <0.001 | 0.312 | 0.049 | 0.756 | 0.490 | ||
| 6 | Control/ SRNM Low | 218 | 115.7 | 18.5 | 84.5 a | 18.8 ab | 47.6 | 0.88 | 93.8 |
| SRNM Med | 230 | 121.8 | 19.4 | 84.6 a | 18.8 ab | 41.8 | 0.83 | 94.0 | |
| SRNM High | 258 | 121.5 | 19.2 | 74.4 b | 19.0 a | 43.8 | 0.92 | 93.6 | |
| YGNM | 308 | 128.1 | 19.9 | 64.6 c | 18.7 b | 53.5 | 0.89 | 93.7 | |
| ACB | 381 | 123.8 | 19.3 | 50.7 d | 18.7 b | 55.6 | 0.88 | 93.7 | |
| p>f | 0.181 | 0.373 | <0.001 | 0.018 | 0.340 | 0.117 | 0.128 |
Results and Discussion
There were significant effects of N supply treatments on root and/or sucrose yields for site years 1 (Jerome 2020) and 4 (Burley 2021) (Table 3). The N supply for the maximum sucrose and root or sucrose yields were highlighted in bold lettering in Table 3. For the remaining site-years there was no significant relationships between N supply treatments and yields (Table 3). The N supplies treatments that maximized yields for site-years 1 and 4 were the SRNM low and SRNM med rates (average N supply = 216 kg N ha-1). For site years 2, 3, 5 and 6, the control treatment average N supply was 181 kg N ha-1. The maximum sucrose and root yields for site-years 1 and 2 were similar, 18.9 and 18.6 Mg sucrose ha-1 and 111.2 and 105.5 Mg roots ha-1, respectively. Across site-years 2, 3, 5 and 6, the sucrose and root yields for the control treatments ranged from 16.6 to 19.1 Mg sucrose ha-1 and 100.3 and 136.5 Mg roots ha-1. The average root yield across all sites and N supply treatments was 115.8 Mg roots ha-1, 22.5% greater than the average yields in Idaho during 2020 and 2021 (89.7 Mg roots ha-1) (Figure 1).
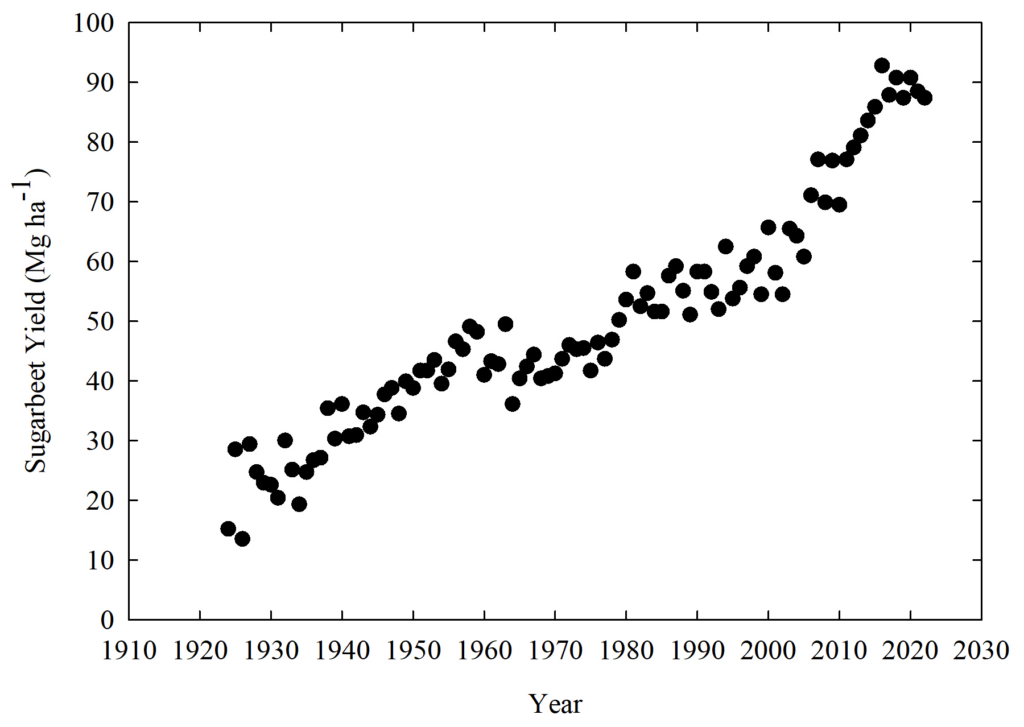
The SRNM low N supply treatment met or was closest to the N supply required to maximize yields than either the YGNM or ACB N supply treatments for 5 of the 6 site years. For the remaining site-year, the SNRN med N supply treatment resulted in maximizing yield. This data agrees with past research showing that the SRNM approach to determining N supply requirement better matches sugarbeet N supply needs than the YGNM approach (Tarkalson, Olsen, Bjorneberg, in submission, this issue; Tarkalson et al., 2018). In this study, the ACB supply treatment used a Nr multiplier ranging from 3.2 to 3.4 kg N Mg-1 roots, which is higher than the range of Nr values used in the current industry recommended YGNM approach (2.75-3.0 kg N Mg-1 roots) (Tarkalson et al., 2016a; Tarkalson et al., 2016b; TASCO, 2020). By comparison, the calculated Nr factor from site-year 1 and 2 of this study was 2.0 kg N Mg-1 roots. Tarkalson, Olsen, Bjorneberg (in submission, this issue) showed that research derived Nr factors have been decreasing over time due to increasing yields (Figure 1) over time and a stable sugarbeet N supply requirement to reach maximum yields over time, supporting past research conclusions that a SRNM approach better meets sugarbeet N supply requirements than a YGNM approach (Tarkalson, Olsen, Bjorneberg, in submission, this issue; Tarkalson et al., 2018).
The YGNM and ACB N supply recommendations over supplied N at all site-years (Table 4). For site years 1 and 2, the amount of excess N was determined by subtracting the YGNM and ACB N supply recommendations from the N supply needed to reach maximum yields (site-year 1 = 202 kg N ha-1, site-year 4 = 230 kg N ha-1) (Table 3). For site years 2, 3, 5 and 6 the amount of excess N was determined by subtracting the YGNM and S ACB N supply recommendations from the N supply of the SRNM low treatment even though there were no differences in yields across all treatments. Although the yields were maximized at the N supply of the control treatment, in a real-world production setting, a recommendation of supplemental N would have been made based on established recommendations. Across all site-years, the YGNM approach recommended an average of 91 kg N ha-1 of excess N fertilizer. Depending on the price of urea in a given year, this represented unnecessary cost to the grower of between $79 to $200 ha-1 (Table 4). The ACB N recommendation was even less accurate, averaging an excess of 140 kg N ha-1 across all site-years, and adding unnecessary cost to the grower of between $122 to $308 ha-1 (Table 4).
Table 4. Excess fertilizer N amount and cost from 2018 to 2022 for the YGNM and ACB recommended N supplies relative to the optimal SNMR N supply. Fertilizer N cost is calculated using the average cost of urea for each year in the U.S. (DTN, 2022). For site-years 1 and 4, the optimal SRNM supply was the N supply that had the maximum yield (Table 3). For site-years 2, 3, 4, and 6, the optimal N supply was considered the SRNM Low treatment (Table 3). We assumed that in a production setting, a SRNM Low N supply was recommended.
| Excess N Calculation | Site Year | Excess Fertilizer N | ————-Cost of Excess N————- | ||||
| 2018 | 2019 | 2020 | 2021 | 2022 | |||
| kg N ha-1 | ——————$ ha-1 ——————- | ||||||
| $0.88 | $0.97 | $0.87 | $1.57 | $2.20 | |||
| YGNM-SRNM Low | 1 | 74 | $65 | $72 | $65 | $117 | $163 |
| YGNM-SRNM Low | 2 | 112 | $99 | $109 | $97 | $176 | $246 |
| YGNM-SRNM Low | 3 | 126 | $111 | $122 | $110 | $198 | $277 |
| YGNM-SRNM Med | 4 | 72 | $63 | $70 | $63 | $113 | $158 |
| YGNM-SRNM Low | 5 | 72 | $63 | $70 | $63 | $113 | $158 |
| YGNM-SRNM Low | 6 | 90 | $79 | $87 | $78 | $141 | $198 |
| Mean | 91 | $80 | $88 | $79 | $143 | $200 | |
| ACB – SRNM Low | 1 | 96 | $84 | $93 | $84 | $151 | $211 |
| ACB – SRNM Low | 2 | 170 | $150 | $165 | $148 | $267 | $374 |
| ACB – SRNM Low | 3 | 192 | $169 | $186 | $167 | $301 | $422 |
| ACB – SRNM Med | 4 | 106 | $93 | $103 | $92 | $166 | $233 |
| ACB – SRNM Low | 5 | 112 | $99 | $109 | $97 | $176 | $246 |
| ACB – SRNM Low | 6 | 163 | $143 | $158 | $142 | $256 | $359 |
| Mean | 140 | $123 | $136 | $122 | $220 | $308 | |
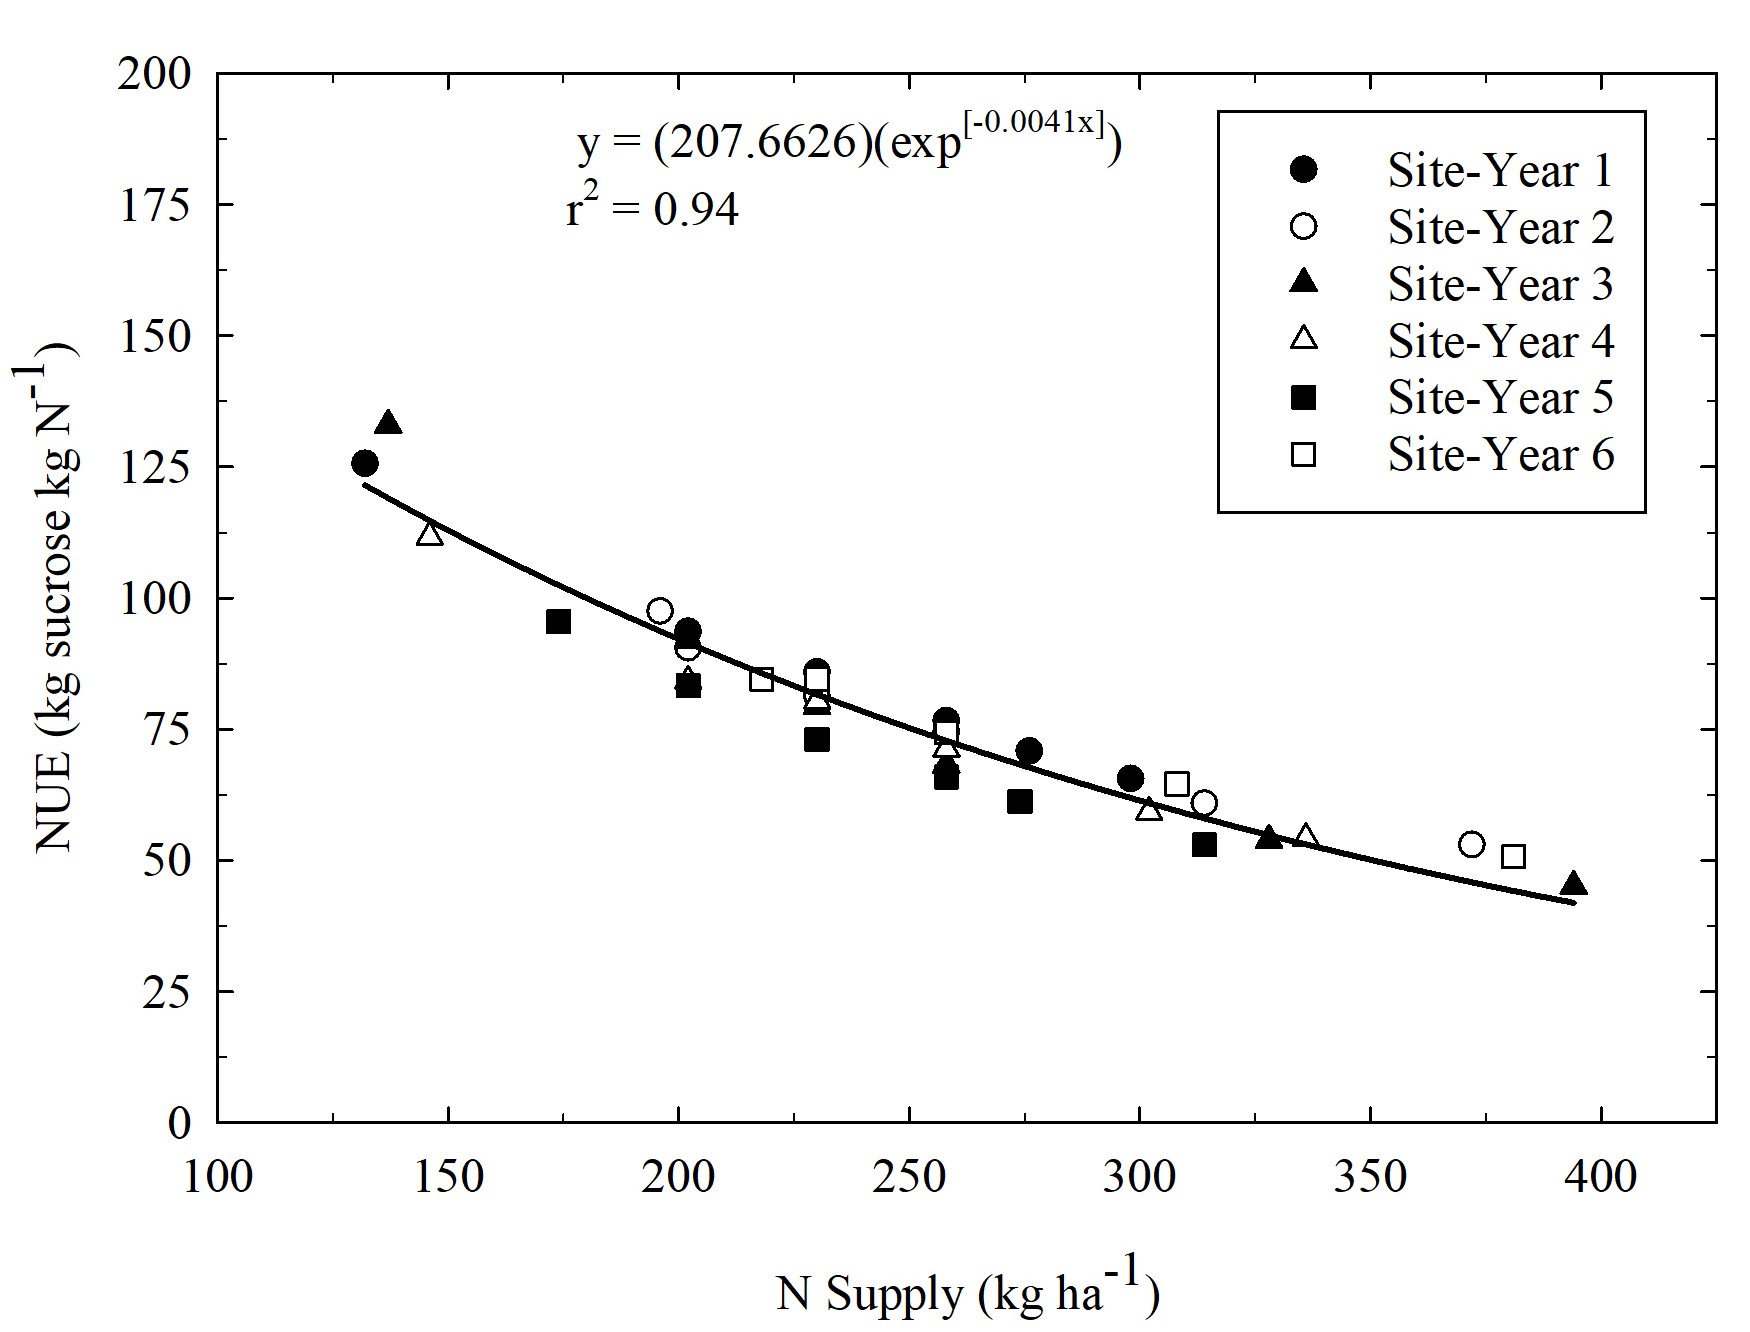
For all site-years, N supply treatments had a significant effect on NUE, and NUE was highly correlated to N supply (Table 3, Figure 2). As N supply increased, NUE decreased. The NUE at the mean N supply required for maximum yield for the two responsive site years (216 kg N ha-1) was 85.7 kg sucrose kg-1 N. This NUE was higher than previous studies conducted in southern Idaho. In research conducted in 2018 and 2019 the NUE was 75.2 kg sucrose kg-1 N, and in research conducted from 2005 to 2010 the NUE was 60.3 kg sucrose kg-1 N (Tarkalson, Olsen, Bjorneberg, in submission, this issue; Tarkalson et al., 2016). As root yields increase over time and N supply required to reach maximum root yields remains relatively stable, the NUE increases. The increase in NUE over time indicates that a SRNM approach is valid.
For site-years 1, 2, 3, and 4, N supply did not affect the quality factors (root sucrose percentage, nitrate, conductivity, and juice purity) (Table 3). Some past research has indicated that sugarbeet root sucrose is negatively correlated with increasing N supply (Tarkalson et al, 2016a; Tarkalson et al, 2016c). However, other research has shown no relationship between N supply and sugarbeet root sucrose (Tarkalson et al., 2012; Tarkalson et al, 2016a). In our study, only site-year 4 had a significant relationship between N supply and sugarbeet root sucrose percent, with the highest rates of N supply showing the lowest sucrose percent (Table 3). Although statistically significant, even these lowest sucrose percentages were still high compared to historic industry averages The highest root sucrose percentage for site year 4 was 20.2%. Nitrogen supply treatments significantly affected root nitrate concentrations for site-years 4 and 5 only. Across all sites root nitrates concentrations ranged from 450 to 18 mg kg-1, with most concentrations lower than the critical threshold considered harmful for sucrose % or sugar quality. Past research has indicated that root nitrate concentrations greater than 200 mg nitrate kg-1, can cause reductions in root sucrose percent (Tarkalson et al., 2016). Only site 2 had root nitrate greater than 200 mg kg-1 (Table 3). At sites 4 and 5 higher rates of N supply caused significantly, though not agronomically important, higher root nitrate concentrations. Across all site-years, there was no significant effect of N supply treatments on root conductivity. Conductivity ranged from 0.54 to 1.0 mmhos cm-1, values considered normal for sugarbeet production. Likewise, PTJP was unaffected by N supply and within range considered typical for sugarbeet production. Across all site years and N supply treatments, the average root conductivity and PJTP was 0.71 mmhos cm-1 and 94.0%, respectively (Table 3).
CONCLUSIONS
This research demonstrated that high yields can be achieved at N supply levels much lower than those recommended by the YGNM or ACB methods, without negative quality issues. This will result in improved N use efficiency and reduced fertilizer N costs for growers. For 5 of the 6 site-years in this study, the SRNM low N supply treatment met or was closer to the N supply required to maximize yields than either the YGNM or ACB N supply treatments. For the sixth site, the SRNM med N supply treatment maximized yield. Following the current recommended YGNM approach, an average of 91 kg N ha-1 in excess fertilizer N was applied, costing from $79 to $200 ha-1 depending on N price variations from 2018 to 2022. Following the current recommended ACB N recommendations, an average of 140 kg N ha-1 in excess fertilizer N was applied costing from $122 to $308 ha-1 depending on N price variations. Of the three SRNM levels tested, the low and mid rates were superior in maximizing yields than the SRNM high treatment. The SRNM approach better matches N supply with crop need compared to the YGNM and ACB N recommendations over time.
References
TASCO. 2020. Sugar beet Growers Guide Book. TASCO, LLC. Boise, ID.
DTN, 2022. www.dtn.com.
Bartens, A., 2005. International Commission for Uniform Methods of Sugar Analysis Methods Book 2005. p. 431. Dr. Albert Bartens KG, Berlin, Germany.
Carter, J.N. and D.J. Traveller. 1981. Effect of time and amount of nitrogen uptake on sugarbeet growth and yield. Agron. J. 73:665-671.
James, D.W., A.W. Richards, W.H. Weaver, and R.L. Reeder. 1971. Residual soil nitrate measurement as a basis for managing nitrogen fertilizer practices for sugarbeets. J. Amer. Soc. Sug. Beet Tech. 16:313-322.
Mulvaney, R.L. 1996. Nitrogen-inorganic forms. p. 1123-1184. In D.L. Sparks (ed.) Methods of soil analysis: Part 3. SSSA Book Ser. 5. SSSA, Madison, WI.
Tarkalson, D.D., D. Bjorneberg, and A. Moore. 2012. Effects of tillage system and nitrogen supply on sugarbeet production. Journal of Sugar Beet Research. 49:79-102.
Tarkalson, D.D., and Bjorneberg, D.L. 2018. Is static nitrogen management in Northwest U.S. sugar production appropriate? Agriculture & Environmental Letters. doi: 10.2134/ael2018.01.0001.
Tarkalson, D.D., D.L. Bjorneberg, S. Camp, G. Dean, D. Elison and R. Foote. 2016a. Improving nitrogen management in Pacific Northwest sugarbeet production. J of Sugar Beet Res. 53:14-36. 2016.
Tarkalson, D.D., D.L. Bjorneberg, and A. Moore, 2016c. Fall and spring tillage effects on sugarbeet production. Journal of Sugar Beet Research. 52:30-38.
USDA-NASS, 2022 Online: https://www.nass.usda.gov/ (Accessed 10 October 2022).
Tarkalson, D.D., Bjorneberg, D.L., Dean, G., Camp, S., Elison, D., and Foote, P. 2016b. Nitrogen: How much is needed? Sugar Guide. USDA-ARS, Kimberly, ID.
ACKNOWLEDGEMENTS
This research was supported by the U.S. Department of Agriculture, Agricultural Research Service. Mention of trade names or commercial products in this article is solely for the purpose of providing specific information and does not imply recommendation or endorsement by the U.S. Department of Agriculture. The USDA is an equal opportunity employer.